If you run more than one location, or you're an agency managing clients with multiple locations, you've probably been switching between accounts to check how each one is doing.
It’s inconvenient, and problems at one location can go unnoticed for weeks. A location with a slow response rate or a sudden rating drop won't show up on your radar unless you go check that specific account.
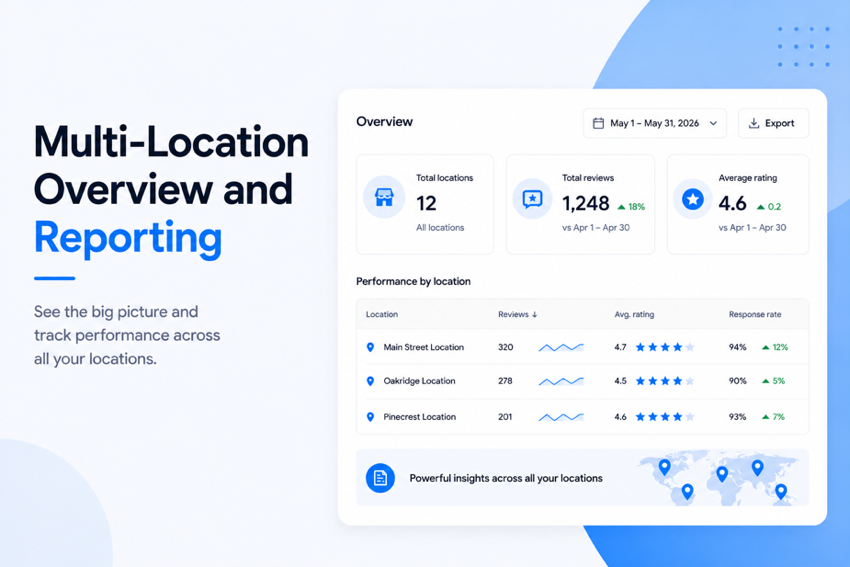
The new “All Locations” view fixes that. You get every location on one screen with reviews, ratings, and response rates side by side.
What you'll see when you switch to All Locations
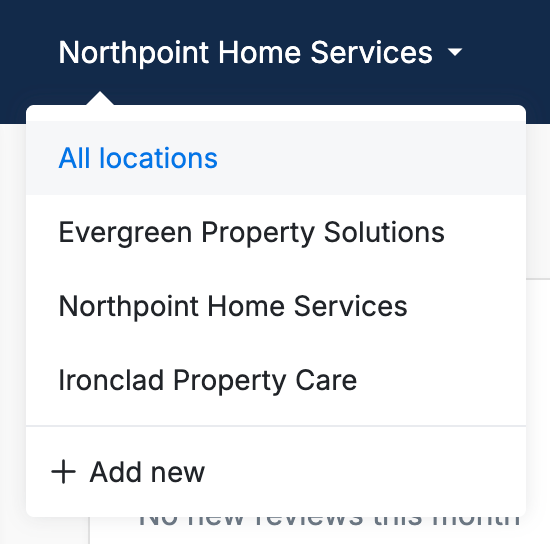
At the top of your dashboard, the location selector now includes an “All locations” option. Selecting it gives you a combined view of every location in your account.
The overview leads with three headline numbers covering your entire business: total reviews, average rating, and 90-day response rate.
Each one shows a trend indicator against the previous 90 days, so you can see whether things are moving in the right direction without doing the math yourself.
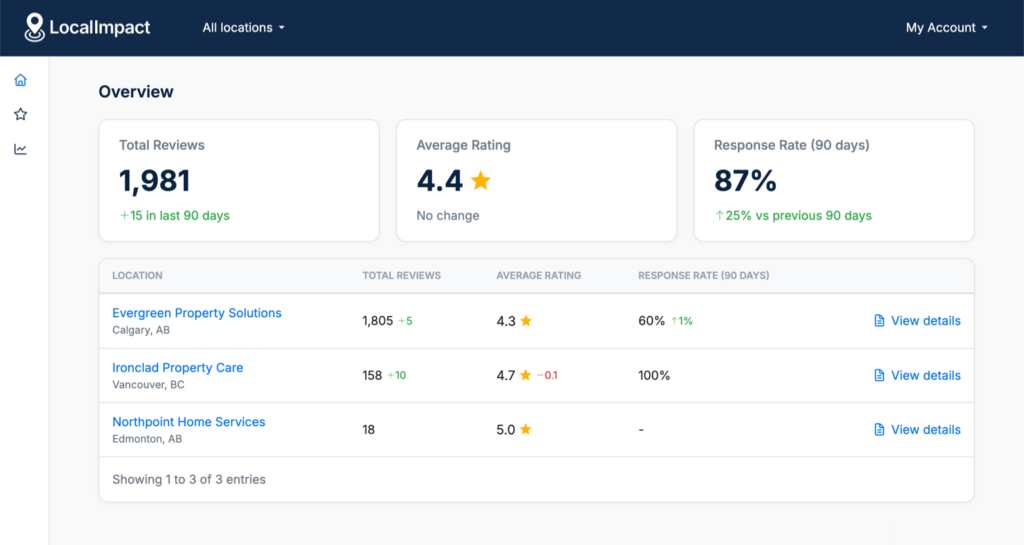
Below the headline metrics, you'll find a table with every location and the same three metrics broken out per site.
Each row also shows how each metric has changed, so a location that's gained reviews, lost rating points, or improved its response rate stands out at a glance.
A "View details" link on each row takes you into that specific location when you need to dig deeper.
There's also a combined review feed that pulls every review from every location into one place.
You can monitor and reply without switching accounts, which speeds things up considerably if you respond to reviews yourself or have one team member handling replies across sites.
The three numbers to check first
When you open the “All Locations” view, here's where to look at first:
- Response rate gap between locations: If one location is at 100% and another is at 60%, that's likely an operations problem at the underperforming location. Someone isn't getting the alerts, isn't prioritizing replies, or doesn't know it's their job.
- Rating gap of 0.3 stars or more between locations: A meaningful gap between your best and worst performing location usually points to something specific at the lower-rated location. Could be a staffing issue, a training gap, or inconsistent service delivery.
- Review volume drop at any single location: If one location's review count flatlines or drops while others keep growing, the review request workflow is probably broken at that site. A QR code got covered up, an integration disconnected, or a staff member who used to send requests left.
What the patterns usually mean
A few combinations come up often enough to be worth flagging.
High review volume but a low average rating
This usually points to a specific operational issue at that location.
Customers are showing up and they're being asked for reviews, but something about the experience is consistently disappointing them. Worth a closer look at staffing, hours, or recent changes at that location.
Low volume but a high rating
This location is typically delivering great service without anyone asking for reviews.
It's the easiest situation to fix, because the service is already good. Add a request workflow and the reviews will come.
High response rate but a low rating
Someone is replying diligently to negative reviews without anything changing on the ground. Replies matter, but they aren't a substitute for fixing the underlying issue.
If the rating isn't moving despite consistent responses, the feedback in those reviews probably needs to make its way to whoever can actually act on it.
For agencies: client reporting in one screen
If you use Organizations to group client businesses, each organization gets its own “All Locations” view.
That means you can open a client's organization, see all of their locations in one place, and pull a report without logging in and out or building anything in a spreadsheet.
For monthly client reporting, the workflow is straightforward. Open the client's organization, screenshot the overview, note the trends in the headline numbers, and drill into any location showing a meaningful change.
The combined view also makes it easier to write a proper recap, because the data tells you what happened across the client's entire footprint instead of one site at a time.
If you're on the white-label plan, the dashboard your client sees carries your brand, so the “All Locations” view becomes a reporting surface you can show clients directly without any LocalImpact branding in the way.
A few things to know
The “All Locations” view shows combined data across every location in the account or organization.
Some actions still apply to a specific location, like editing a business profile or configuring campaigns and settings for that location. To add or remove locations, you'll still go to the Businesses page.
Try it out
The location selector at the top of your dashboard now includes “All locations”. Click it and you're in.
If you're not using LocalImpact yet, you can start a free trial and get the “All Locations” view along with everything else, including AI-powered review responses, review request workflows, and white-label options for agencies.